


Product Application
AT-Web/Logger gateway is a Raspberry Pi based gateway that supports:
- Monitoring and control Modbus RTU Rs485 protocol based devices on website. The gateway is a web server.
- Data log devices memory values onto AT-Cloud server for trending, alarming and reporting.
Application:
- Temperature monitoring system in vaccine storage, medicine storage, cold storage,...
- Temperature and humidity monitoring system in server room, warehouse, document storage,...
- Power management system in factory, building,...
Feature
1) Login
2) View
3) Control
4) Trend
5) Settings
6) Report
Website Address & Login
Website address
Access the website on the gateway by: http://[Ip_address]:9000
- [Ip_address]: Ip address of Gateway in local area network (LAN), default IP is printed on the cover of gateway. You can search on "http://atscada.com" for "how to change the default IP of raspberry Pi" if you want to change this value.
- 9000 : Port (Default) .
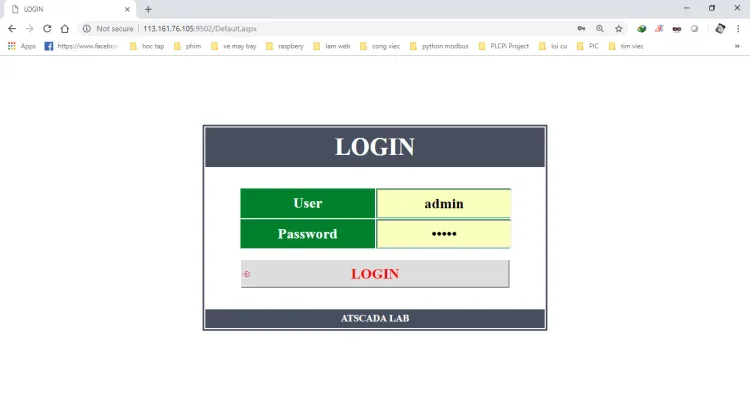
Login page
Login Page is default webpage when you access the website.
- User name (default): admin
- Password (option): admin
You can change password in Setting.
On Menu tab, you can see functions: View, control, trend, settings, report, exit.
Monitoring Interface
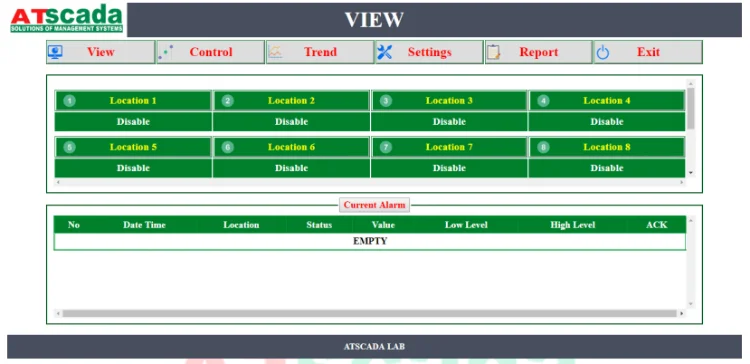
After log in, "View" page will appear.
Displays maximum 16 locations.
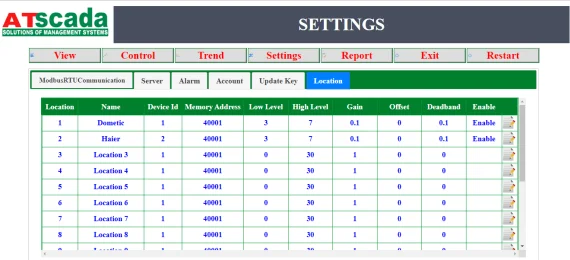
Each location includes name and value. The name and Modbus RTU memory address of the location can be set at settings feature.
Current Alarm
View the latest 10 alarm events. Alarm events are actived when the real-time value of the memory is lower than Low level or higher than High-Level set in the Settings feature.
Alarm event details: Date, Location (Name), Status, Value, Low, High, ACK.
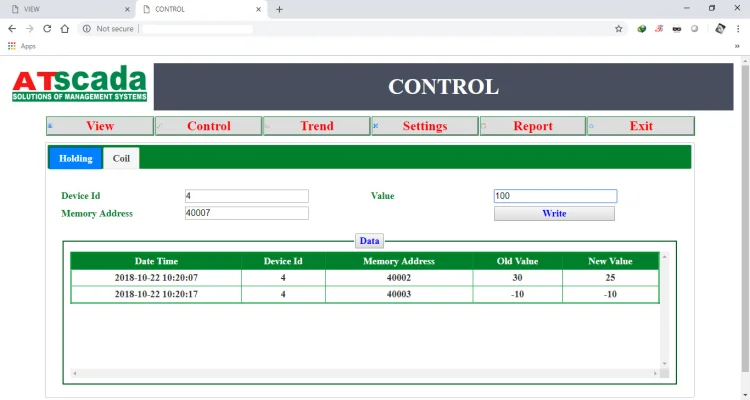
Allow operators to write values to memory devices. Memory address is Modbus RTU register address. There are two types of memories that you can write: Coils Registers and Holding Registers.
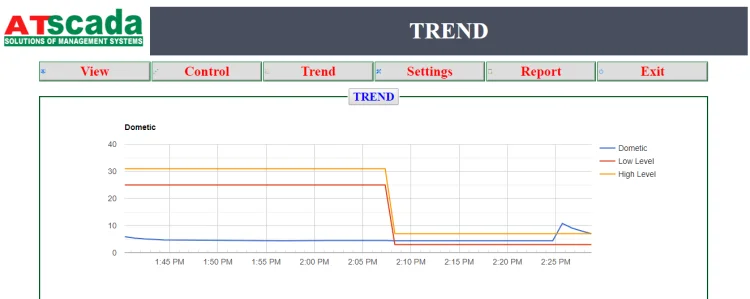
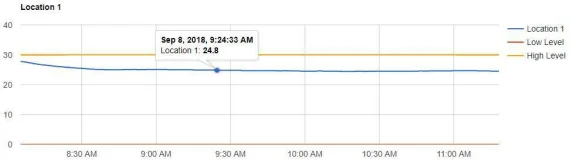
Displays the value of each location according to the chart on the current day (from 0h to the current time).
Move the mouse point in the trend to see the value at each timestamp.
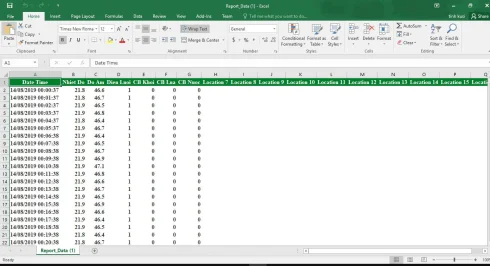
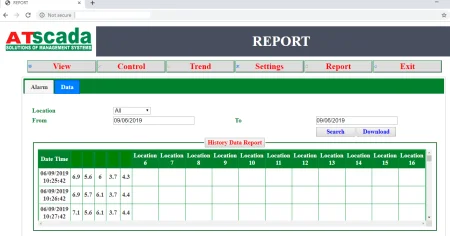

View report data grid and export to excel.
There are two tabs:
- "Alarm" to query historical alarm events.
- "Data" to query logged data values.
Click "Download" to export and download file.
